- ian@etherintroductions.com
- 07795 275934
Insurance Supply Chain Experts

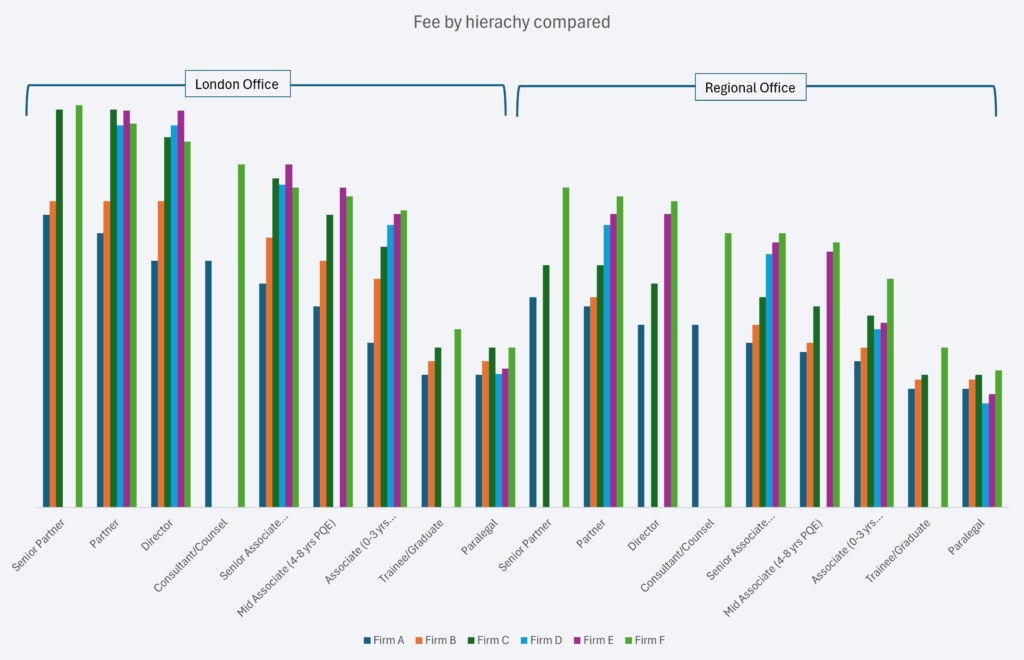
Starting with the basics – comparing different firms rates by fee hierarchy. This is done by lines of business and then separated out into different offices, namely London and then regional.
As can be seen there is a wide difference in rates by firms. And all firms offer markedly cheaper rates in regional hubs compared to London offices.
We have extensive rates for comparison, although at this stage it is not possible to provide meaningful insights without further data analysis.
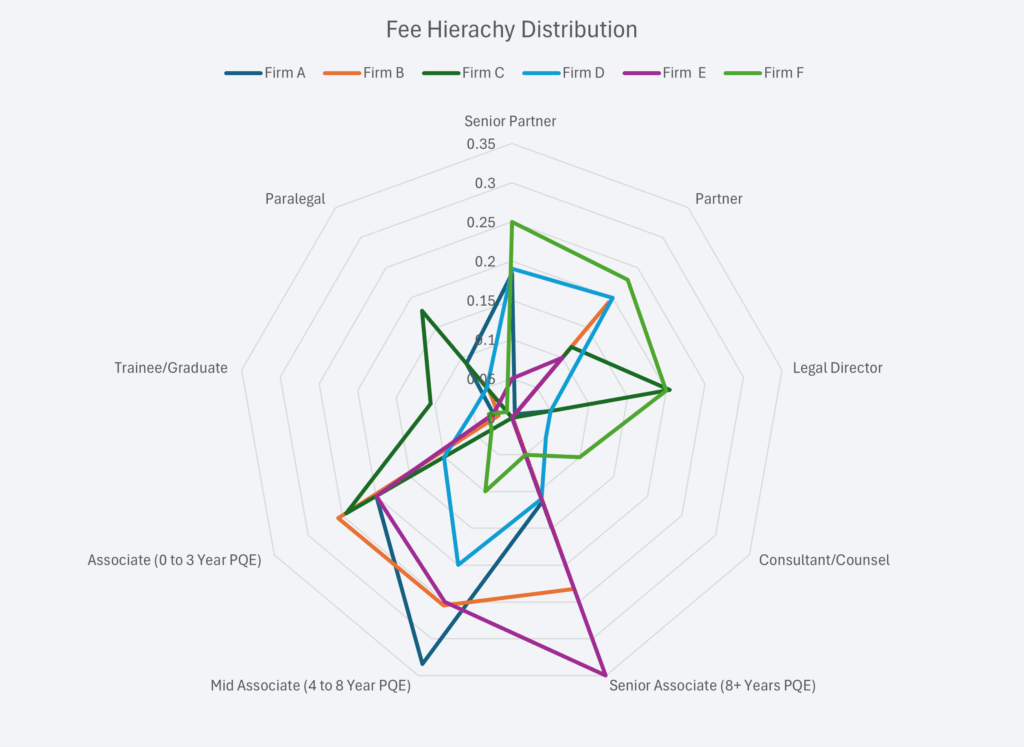
To get towards having a meaningful data set for comparison purposes, we first need to see where each firms fee distribution is.
As is evident in the data set, there is a marked difference between firms of which fee hierarchy is the most prevalent. Firm F is very heavily weighed towards the top 3 earners (Senior Partner, Partner and Director). Firms B and E are more weighted to the associate bandings.
This makes a big difference to the overall weighted fee per hour when comparing firms.
To obtain a true picture of the average fee per hour by firm, we undertake this process for both the London and Regional offices. We then apply a weighting to the usage of these offices, and arrive at a final blended rate per hour.
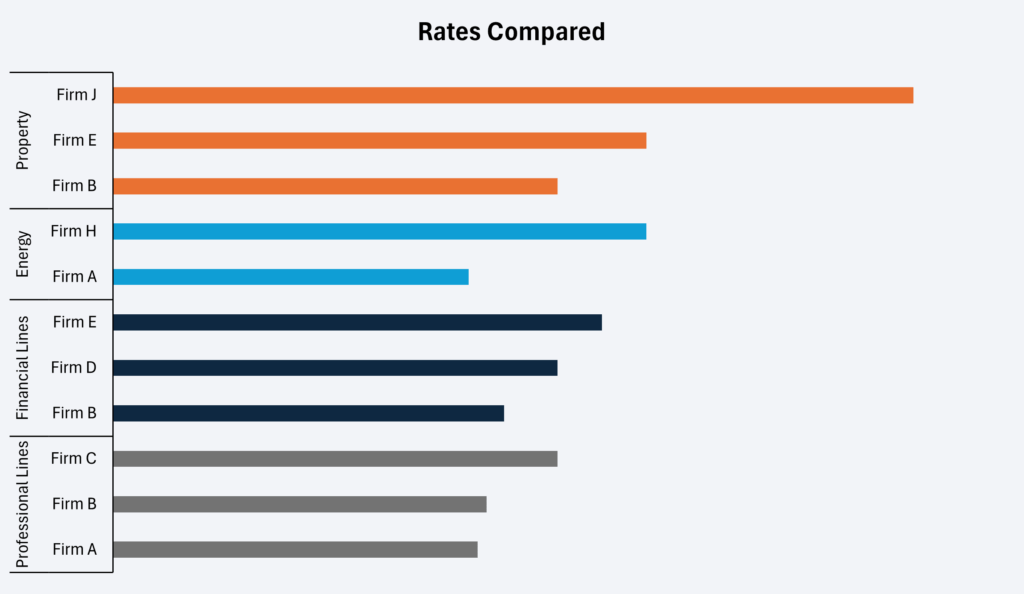
Hourly rates will vary by the Line of Business the matter will relate to. We compare all rates from an insurers panel, applying the blended average. By doing this we are able to compare true costs per hour across any panel firm.
Once we have collated the cost data we are able to immediately see the disparity in costs by firms. For example, on Property matters, is Firm J really worth the extra uplift on costs compared to Firms E and B? Often the answer is yes so the next stage is to quantify why that is.
In most cases though, the general feedback is that the panel firms are, to a lesser or greater degree, equal. In which case we adopt a two tier approach:
Comparing existing legal providers is a highly effective way to reduce costs within the panel. However, you don’t know how cost effective the panel is compared to the wider market.
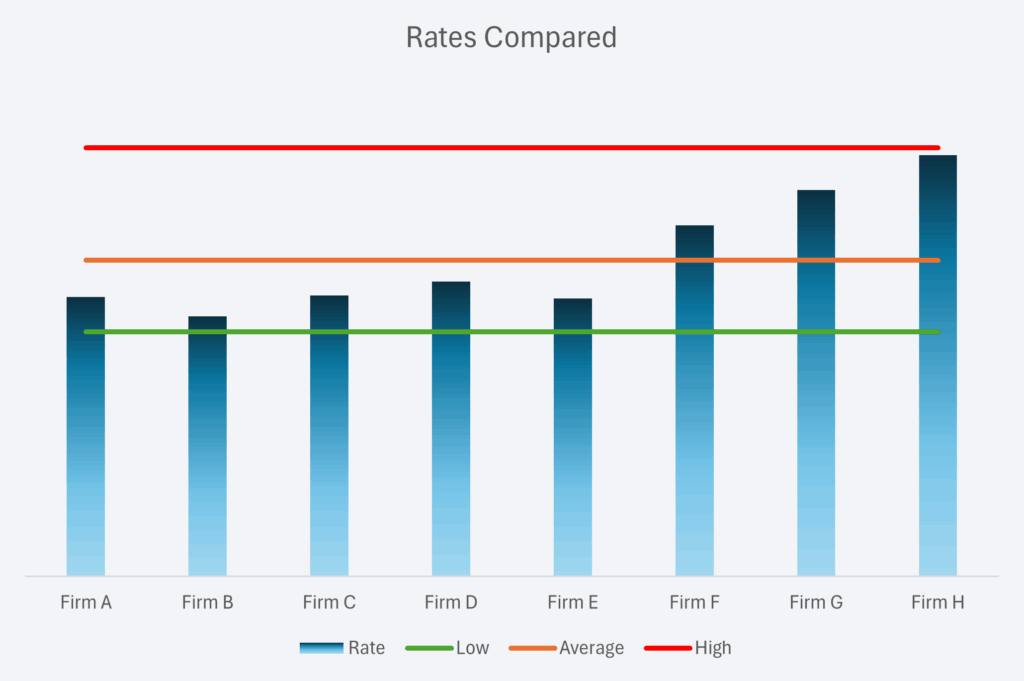
We have thousands of data points collected as a wider industry benchmarking. As such we are able to provide an insight into how your cost base compares to the wider market.
Whilst Firms A through E are all billing an average hourly fee below the market average, Firms F through H are comparatively high. Firm H is approaching the top rate found in the market.

Managing claims supply spend effectively is crucial. But before you can optimize, you need to

We have full data sets covering the fees incurred, the claims outcome (fulfilled, cashed, zero settlement) and the final indemnity spend for surveyors.
For building repairs we have regional indemnity averages, national indemnity averages and claims management fees comparisons.
At our disposal is a full set of fee data covering various claims types at every value banding.
Of course fees are only one aspect of a loss adjusters output and we have adherence to fee scale data as well as the all important average indemnity controls.


Covering UK, USA and some other territories, we have an extensive data set on TPA’s.
Fees, conversions to Loss Adjusters, indemnity controls and claims outcomes are all covered. We also have data on low value claims as well as more complex and specialist claims.
Over the years we have built up a comprehensive set of legal rates covering most territories around the globe.
These are split by individual hourly rates according to seniority, by type of matter, and by the location the services would be provided.


Multiple data points covering the key metrics which provide valuable insights into how an insurance book of business is performing.
Our insights cover loss ratios, elapsed days from FNOL to closure, reopening rates, claims outcomes, average and total indemnity spend.

Reviewing your legal panel, especially if it has grown organically over a period of years,


