- ian@etherintroductions.com
- 07795 275934
Insurance Supply Chain Experts

My journey in the insurance industry began as a graduate trainee loss adjuster, handling a wide array of domestic and commercial claims across East London. This foundational experience provided me with a granular understanding of the claims process from the ground up.
Over time, I transitioned into overseeing claims teams and building repair networks, culminating in a leadership role with responsibility for the claims supply chain at a global insurer. I have extensive experience in claims auditing and TPA (Third Party Administrator) management, including the creation and optimization of TPA models suited to Lloyd’s and the broader London market. My skillset includes negotiating legal services in the London market to deliver optimal value and results across complex, multi-jurisdictional claims. This unique career trajectory has given me a comprehensive, 360-degree perspective on the claims ecosystem—understanding not only claims management but also the intricate network of suppliers, partners, TPAs, and technologies that drive successful outcomes across the London insurance market. My expertise enables me to deliver tailored solutions and strategic value for Lloyd’s syndicates and London market participants operating in an evolving risk environment.
I don’t just understand claims; I understand the intricate network of suppliers, partners, and technologies that drive successful outcomes across multiple classes of business.
My experience spans the full spectrum of the insurance claims landscape.
Proud to have consulted for some of the biggest names in the insurance sector.

Let’s discuss how my experience can deliver value to your business. Whether you need strategic advice, project management, or procurement expertise, I’m here to help.

The key drivers to your spend control will be the model you use and the controls inherent in the building process. Cash is increasingly king. Consumer duty means that any supply chain activity, like building repairs, that has a liklihood of a complaint is not ideal. Cash is quiet in this respect. Cash is also cheaper. The VAT and HSE element can be avoided using local trades chosen by the consumer. However, the lowest DIY rate is no generally no longer applied (Consumer Duty).
Not all claims are equal. Certain perils have very different liability considerations and outcomes than others.
Based on 2024 settlements, claims for storms are frequently declined with only 32% of all claims made leading to a claims settlement. For that reason, establishing if a claim is valid is the primary concern. This is why more experts (surveyors/loss adjusters) are appointed on this peril.
Conversely, Excape of Water (EOW) claims result in a claims settlement in 82% of all claims made. The focus is therefore more on the claims amount to be agreed than coverage itself.
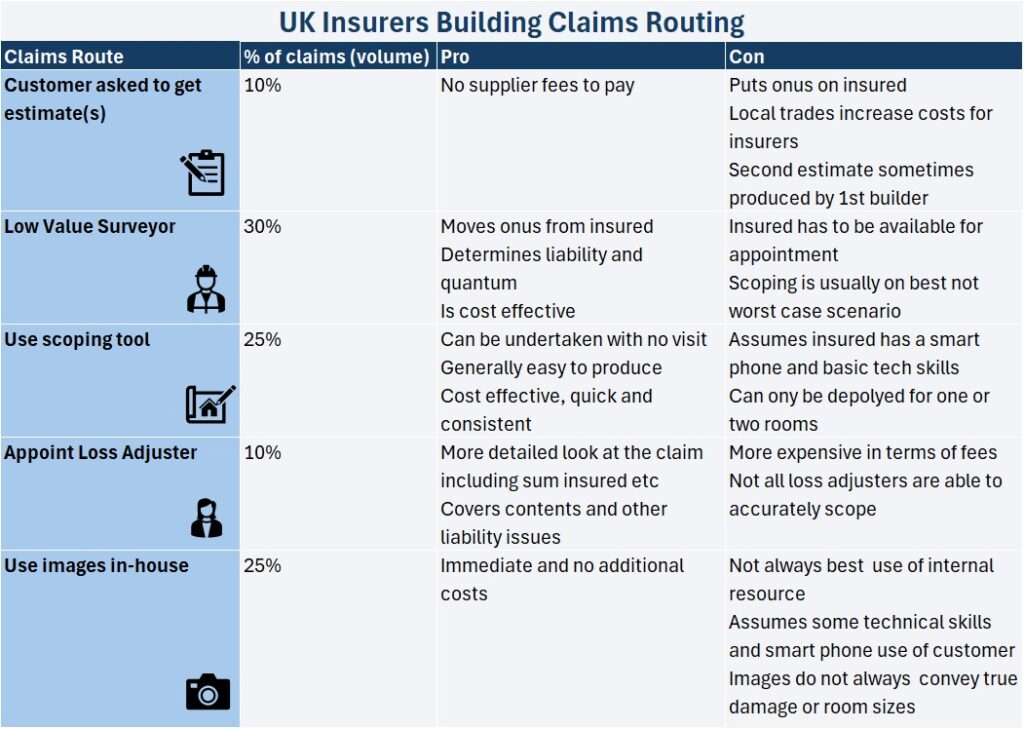
In addition to the peril type, the claims distribution by route depends on how each insurer’s claims department is set up. Some are pushing more through automated routes (up to 70%), whereas others will outsource more.
We have comparable data in the industry for outcome type. The focus of the property spend comparions is on the settlement amount.
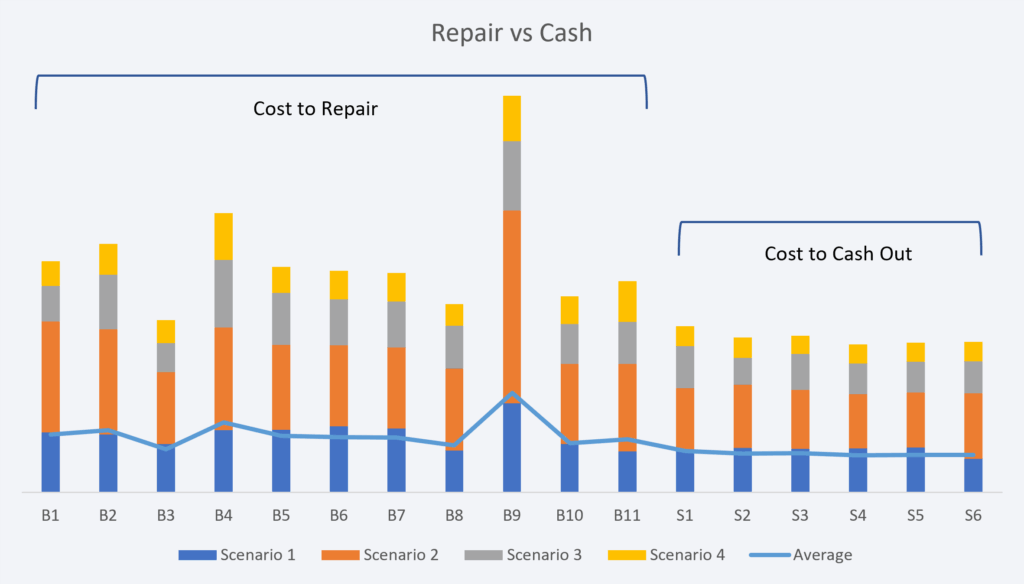
Cashing out a building repair is cheaper than repairing it via an approved builder. Looking at our data set covering the same repairs, using a network builder always costs more.
The main reason is larger builders carry a heavier administration cost base. Support staff process and report on the claims element as well as liasing with insurers and other parties. Additionally, most insurers use buildings claims software which cost the builder on a per click basis.
Finally, most have to charge VAT on labour and materials unlike some smaller local trades who charge VAT on materials only.
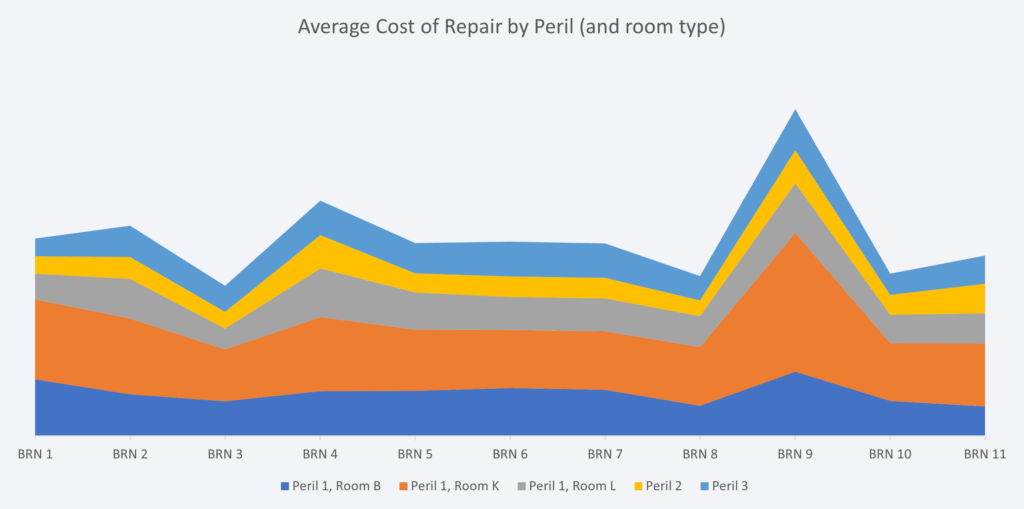
Using multiple data points across room type and peril, we can compare cashing out amounts across a typical selection of claims.
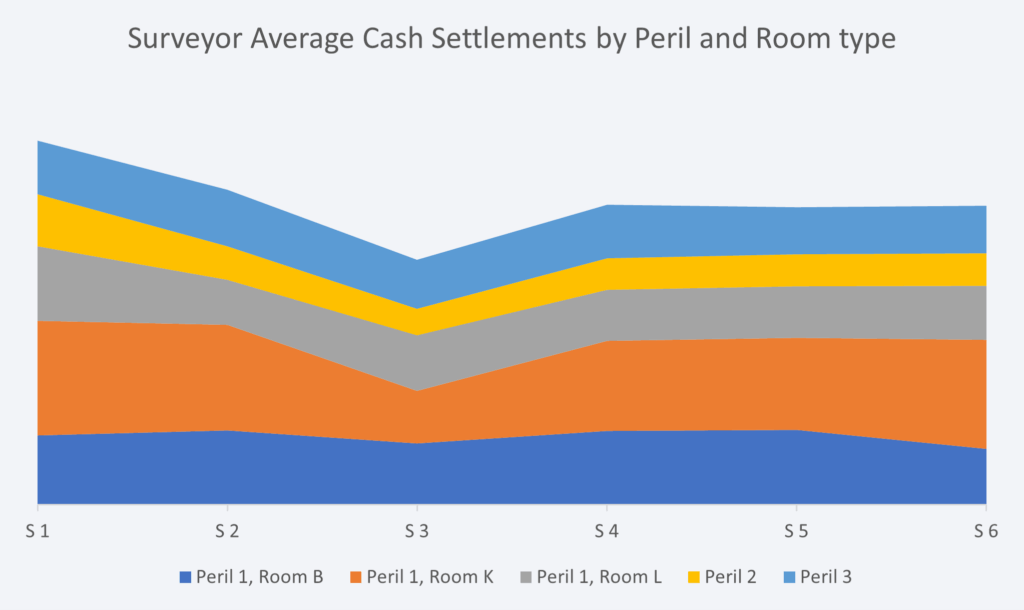
When it comes to scoping a repair, it is normal to get different estimated repair costs. In fact using the same methodology and systems, no two estimates are the same. No matter how skilled the estimator is. So to get variations accross different firms is to be expected.
What we are looking for is consistancy over a “basket of goods”.
What can be seen in this analysis is the grouping of cash settlements. Suppliers S2, S4, S5 and S6 are returning consistant (albeit sightly different) cost estimates. S1 is overscoping on each scenario. Conversely S3 is under valuing the claim amount.
Lower costs are good though right? Not when they are clearly below the market rate. Consumer Duty must be considered. In the event that the customer takes the cash and tries to engage a local trade, they will find out that they have been under paid. This has two implications:
Both of these cost money. So any savings made by undervaluing the claim are lost.
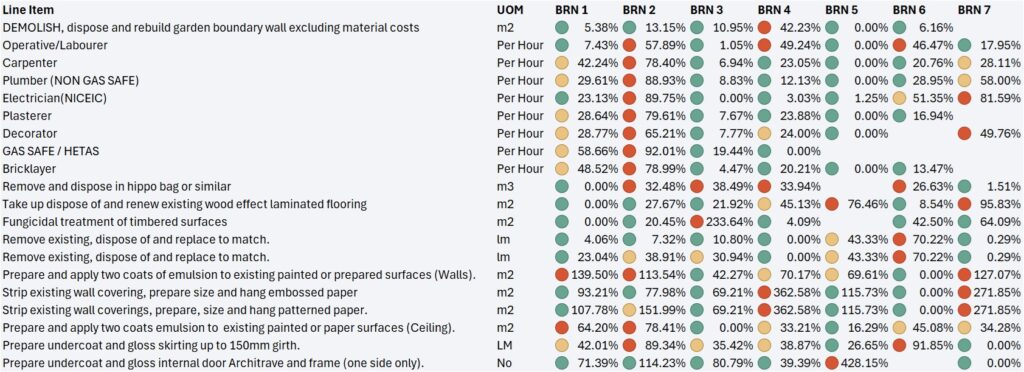
To start to understand how to compare builders and network costs, we first need to look at the rates used.
Even if you are able to agree a consistant rate card for each repair element, there will be always be regional differences on labour costs. (Materials tend to be uniform).
As can be seen, there is a vast difference between these seven national builders when it comes to individual line items.
Although individual rate comparisons are useful, it is the application of these rates that will drive the largest difference in repair costs.
Using the same methodology as for cashing out, we have multiple data points on a typical claims portfolio. As can be seen, there is an averaging out accross suppliers BRN1, BRN2, and BRN’s 5 to 7. BRN’s 3, 8 and 10 are significantly lower, with BRN 9 an expensive outlier.
Again, this is fairly typical from the audits we have undertaken. High cost overheads and over scoping can be common. Conversely, low costs and tight scoping can lead to very affordble, yet quality repairs.
When it comes to engaging with a builder network rather than individual firms, the key is the assessment of how tightly that network manages the individual builders.
When you engage with a network instead of individual builder firms, the final aspect to consider is the fee structure. Whilst a builder earns profits from the rate card, the network needs a fee income to cover their management costs.
Our best advice is to avoid a percentage applied to the repair cost. It is expensive and it rewards higher repair costs.
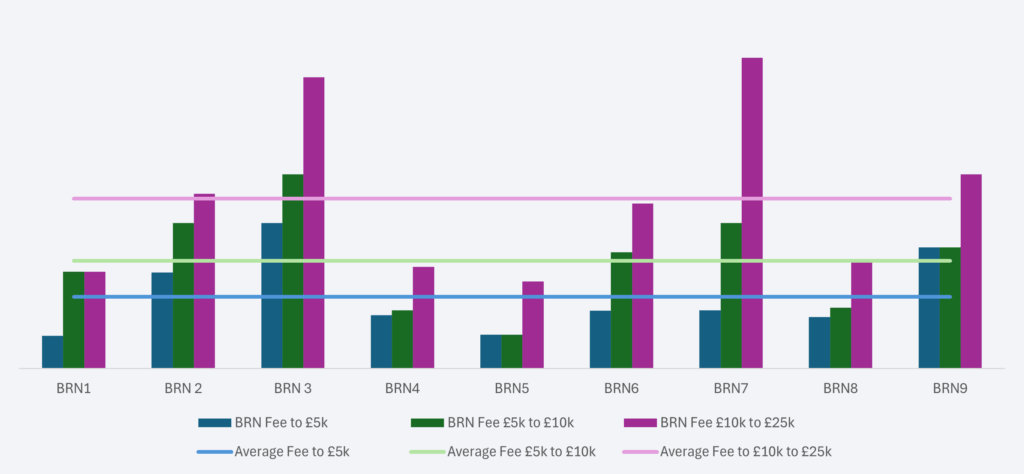
Instead look to have a fixed fee banding applied to the claim.
As can be seen, fees vary considerably. Too low and there will inevitably be fewer controls on the repair costs. Too high, and you are not getting value for money.
Lookng at the data, at first glance it appears that BRN 3 and 7 and simply too expensive. However, if you look at the bandings, BRN 7 is more proportionate to the increased repair costs. If the indemnity controls (repair costs) show that they are controlling that spend, it may well be worth the increase. BRN 3 is simply too expensive, especially at lower value repairs where controls will not deliver reduced costs.

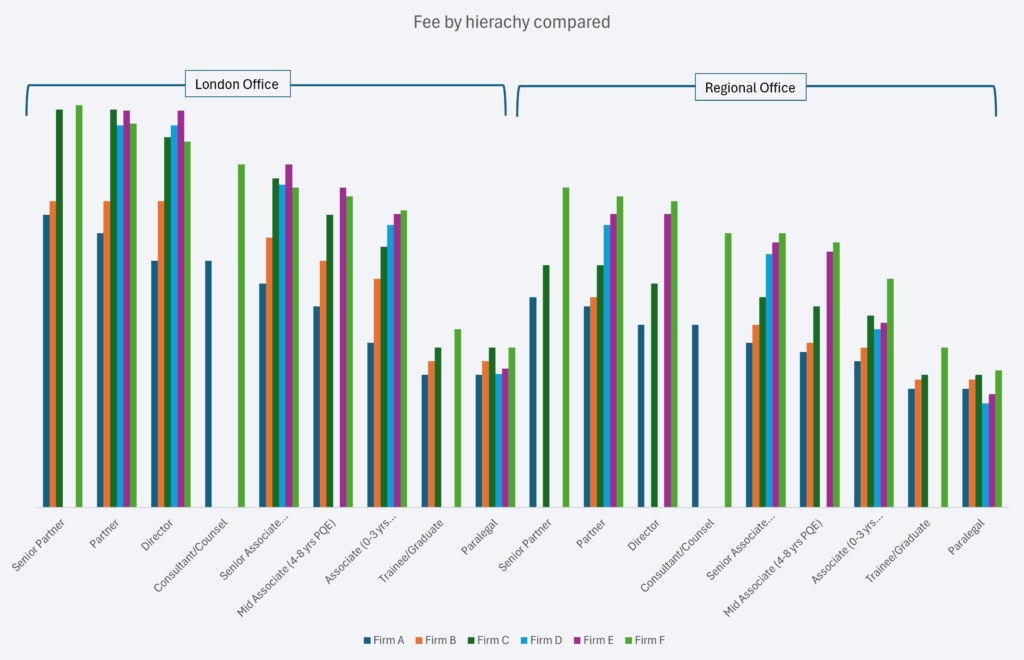
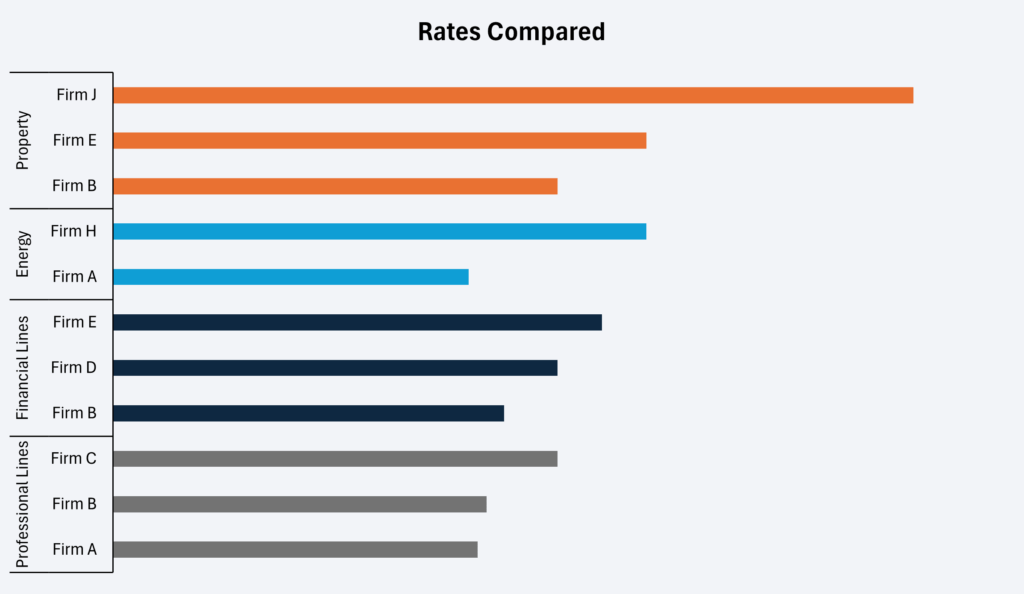
Starting with the basics – comparing different firms rates by fee hierarchy. This is done by lines of business and then separated out into different offices, namely London and then regional.
As can be seen there is a wide difference in rates by firms. And all firms offer markedly cheaper rates in regional hubs compared to London offices.
We have extensive rates for comparison, although at this stage it is not possible to provide meaningful insights without further data analysis.
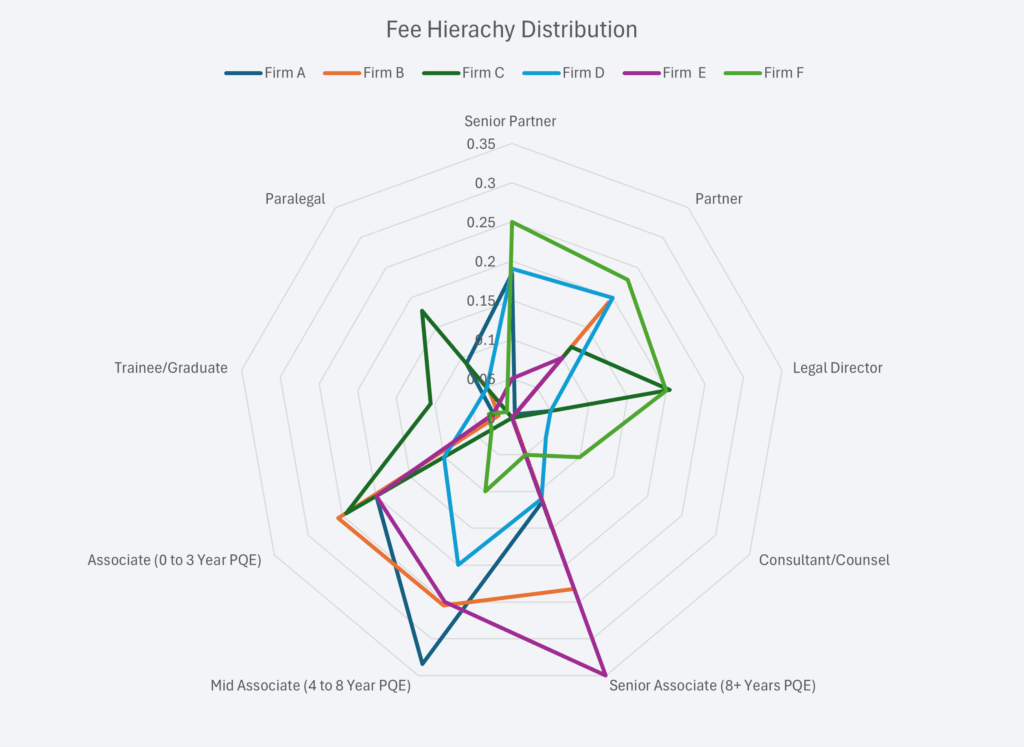
To get towards having a meaningful data set for comparison purposes, we first need to see where each firms fee distribution is.
As is evident in the data set, there is a marked difference between firms of which fee hierarchy is the most prevalent. Firm F is very heavily weighed towards the top 3 earners (Senior Partner, Partner and Director). Firms B and E are more weighted to the associate bandings.
This makes a big difference to the overall weighted fee per hour when comparing firms.
To obtain a true picture of the average fee per hour by firm, we undertake this process for both the London and Regional offices. We then apply a weighting to the usage of these offices, and arrive at a final blended rate per hour.
Hourly rates will vary by the Line of Business the matter will relate to. We compare all rates from an insurers panel, applying the blended average. By doing this we are able to compare true costs per hour across any panel firm.
Once we have collated the cost data we are able to immediately see the disparity in costs by firms. For example, on Property matters, is Firm J really worth the extra uplift on costs compared to Firms E and B? Often the answer is yes so the next stage is to quantify why that is.
In most cases though, the general feedback is that the panel firms are, to a lesser or greater degree, equal. In which case we adopt a two tier approach:
Comparing existing legal providers is a highly effective way to reduce costs within the panel. However, you don’t know how cost effective the panel is compared to the wider market.
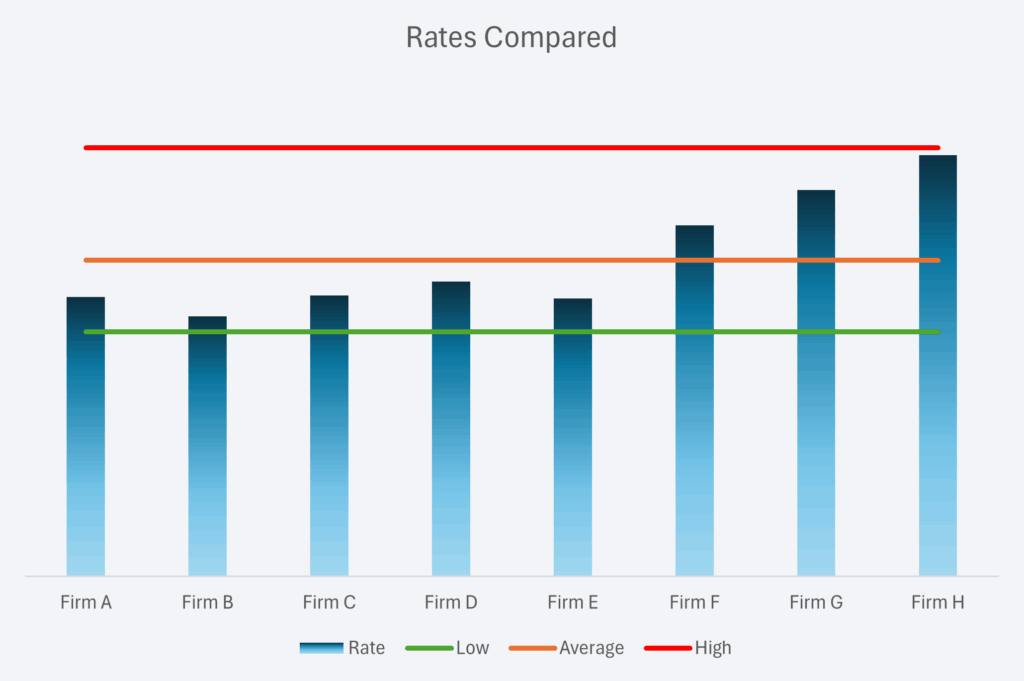
We have thousands of data points collected as a wider industry benchmarking. As such we are able to provide an insight into how your cost base compares to the wider market.
Whilst Firms A through E are all billing an average hourly fee below the market average, Firms F through H are comparatively high. Firm H is approaching the top rate found in the market.
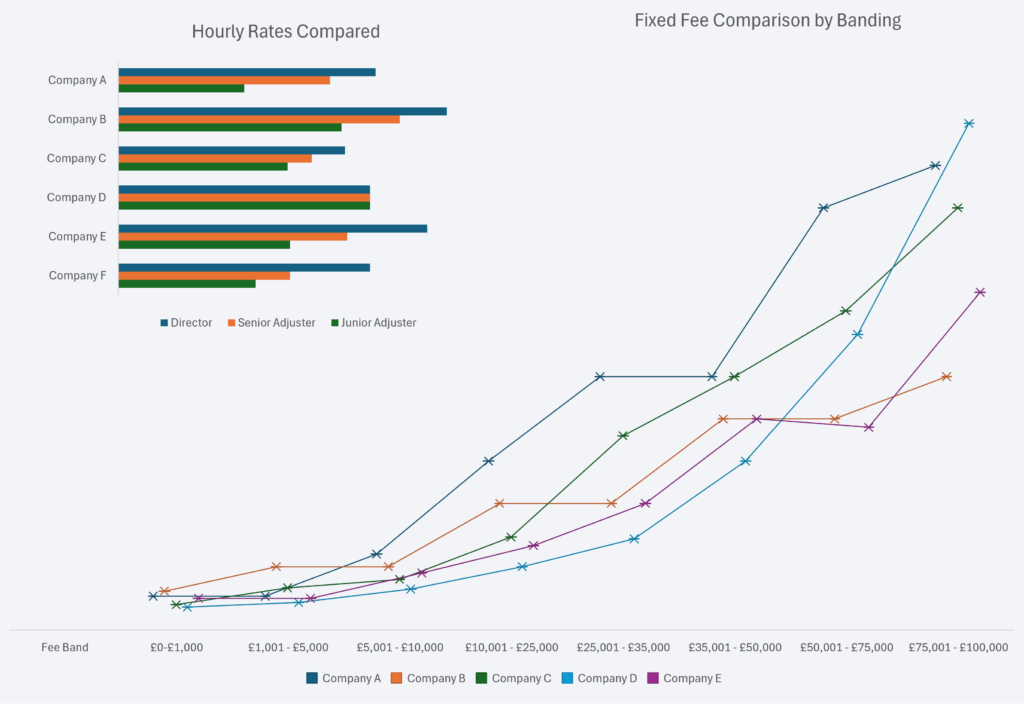
Starting with the basics – comparing different firms fees. This is done by lines of business and then applied by:
The key with banded rates is to understand where your typical claims settlement sits. This way you can compare the band(s) that are most frequent to your book.
We have multiple data sets and are able to advise on how competitive, or not, your negotiated fees are.
Comparing fees by bandings only shows a part of the picture.
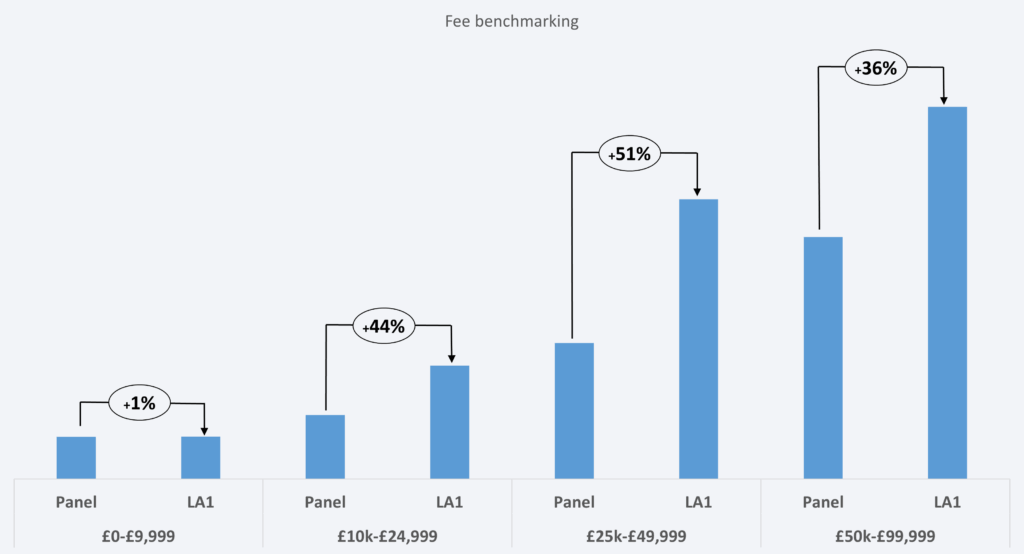
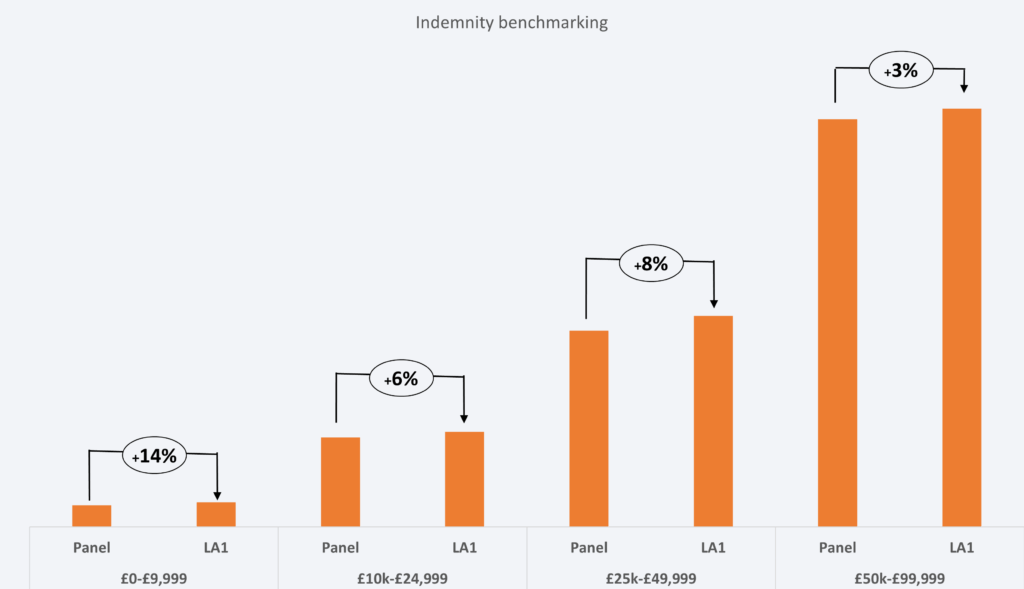
Having undertaken an in depth audit for a leading UK insurer, we found that there was a large difference in average fees. This was despite their being very similar commercial terms.
Firm LA1 was consistently billing more per settlement banding than the other panel firms. In the lower band (up to £10,000) there was no real disparity. In the two bands up to £50,000 however, there was a marked increase in fees.
Our findings showed that on lower value claims, most loss adjuster invoices were as per the fixed fees. At the next two bandings, LA1 was frequently requesting an hourly rate to be applied. This took the claim outside of the pre-agreed fixed fee. This made the average fee significantly higher than the panel average.
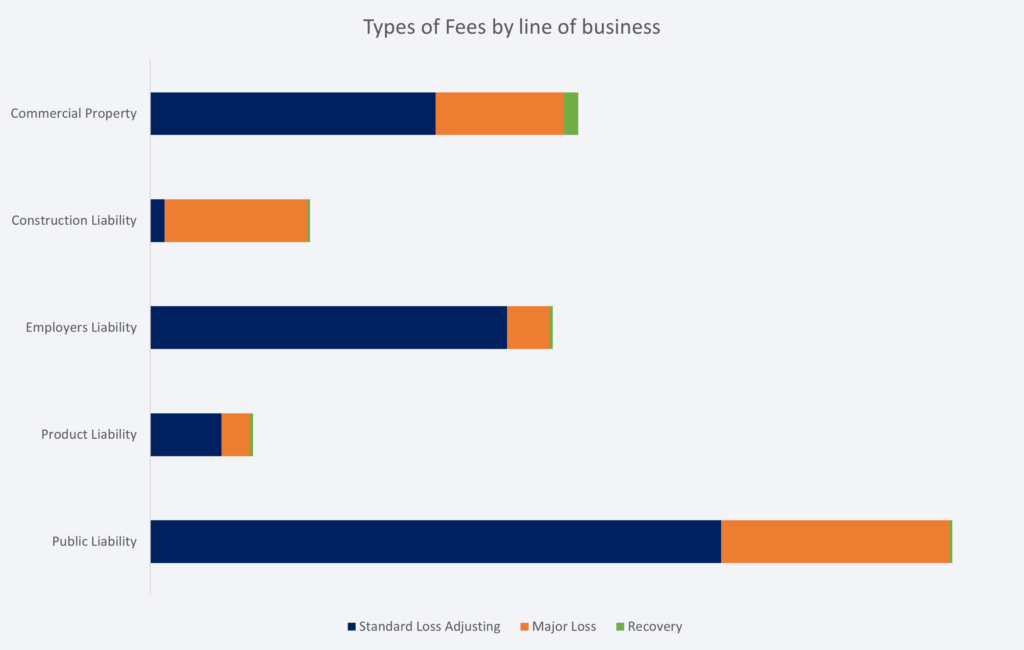
Service costs will naturally vary by line of business so it is vital when comparing average fees or total spend to do this by type.
For example, in a London market audit it was initially felt that the average fee claim settled was too high on Construction Liability claims. However, a data audit soon identified that the vast majority of claims required a major loss adjuster and therefore the application of hourly rates pushed up the average costs.
Conversely, commercial property average fees were the lowest as more claims were billed at the fixed fee bandings and at a recovery rate.
Fees are important but the biggest impact on the claims book is always going to be the indemnity spend. In the case of Loss Adjuster led claims it is ensuring that the panel firm is able to control costs in line with the policy terms and conditions.
In the case of firm LA1, when our audit showed their costs were higher than the panel average, they counter claimed that because of the quality of service, it still represented value for money.
Unfortunately when reviewing the claims outcomes, it became very clear that in fact the opposite was the case and the higher fee was matched by higher average settlement costs.
We generally find that TPA fees don’t self-fund; they won’t cover operational costs. As a consequence, the TPA function becomes a loss leader which can only operate at the fee levels they do if that function can feed another part of the business.
For example, we reviewed the TPA panel for a leading London syndicate’s US property book and found the following;
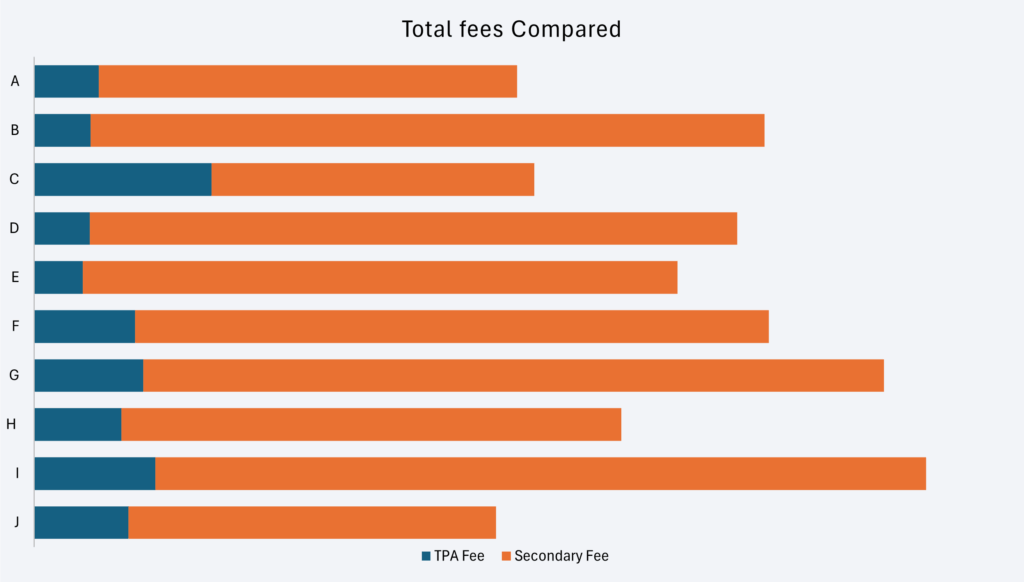
Taking 10 sets of TPA data which cover comparable lines of business, we can see that the secondary fee (loss adjuster or other owned service) is substantially more than the total TPA fee on its own.
Whilst a higher TPA fee can (Firm C) offset the need for higher secondary fees, that is not always the case (Firm I).
The key, as ever, is to be able to compare all aspects of associated fees to be able to provide accurate benchmark comparisons of costs.
Undertaking a full audit of a UK based TPA for a major insurance client, we soon discovered that their primary focus was revenue generation into the wider group.
On average, they were instructing their own companies 2.3 times for each TPA instruction they received. On a large number of instructions, up to 5 group companies were instructed.
The number of low value claims settled at desktop was minimal and secondary fees were spiralling out of control. As can be seen, the TPA fee element of total costs looked quite insignificant.


Fees are obviously only a small part of the overall claims spend. Indemnity, at least on most claims, will always be the higher proportion of total claims costs.
What we look for here is value for money. Larger claims incur larger fees, as do more complex claims even at a lower claims amount threshold.
So when we compare the total fees as a percentage of total claims costs (all fees + indemnity) we can start to draw comparisons between different TPA performances.
On the face of it, Firm E is providing good value for money, whereas Firm G really is not. There is of course a very important caveat to this assumption. If leakage is rampant then value for money will significantly drop. Equally, Firm J looks to be adding less value, but was achieving very strong indemnity controls and fraud detection rates.
It is not just about costs, but service too. When TPA’s instruct themselves it adds complexity and time delays to the claims duration.
Looking at a simplistic measure of indemnity spend vs elapsed days, it is evident that Firm H is taking too long to settle low value claims. In contrast Firms A and G are concluding claims in half that time.
Elapsed days are only one customer measure, but it is an important one.


Demand and Supply Demand and supply has always influenced the price of a product or

Managing claims supply spend effectively is crucial. But before you can optimize, you need to

We have full data sets covering the fees incurred, the claims outcome (fulfilled, cashed, zero settlement) and the final indemnity spend for surveyors.
For building repairs we have regional indemnity averages, national indemnity averages and claims management fees comparisons.
At our disposal is a full set of fee data covering various claims types at every value banding.
Of course fees are only one aspect of a loss adjusters output and we have adherence to fee scale data as well as the all important average indemnity controls.


Covering UK, USA and some other territories, we have an extensive data set on TPA’s.
Fees, conversions to Loss Adjusters, indemnity controls and claims outcomes are all covered. We also have data on low value claims as well as more complex and specialist claims.
Over the years we have built up a comprehensive set of legal rates covering most territories around the globe.
These are split by individual hourly rates according to seniority, by type of matter, and by the location the services would be provided.


Multiple data points covering the key metrics which provide valuable insights into how an insurance book of business is performing.
Our insights cover loss ratios, elapsed days from FNOL to closure, reopening rates, claims outcomes, average and total indemnity spend.

One of our clients had a professional services contract in place with a clear billing


