- ian@etherintroductions.com
- 07795 275934
Insurance Supply Chain Experts
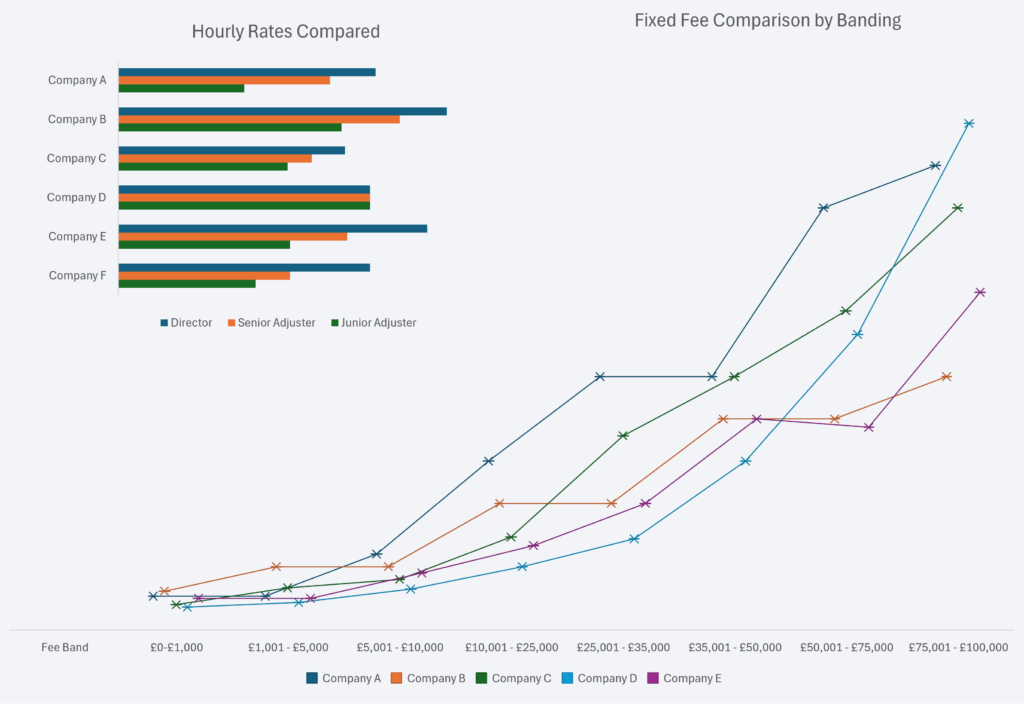
Starting with the basics – comparing different firms fees. This is done by lines of business and then applied by:
The key with banded rates is to understand where your typical claims settlement sits. This way you can compare the band(s) that are most frequent to your book.
We have multiple data sets and are able to advise on how competitive, or not, your negotiated fees are.
Comparing fees by bandings only shows a part of the picture.
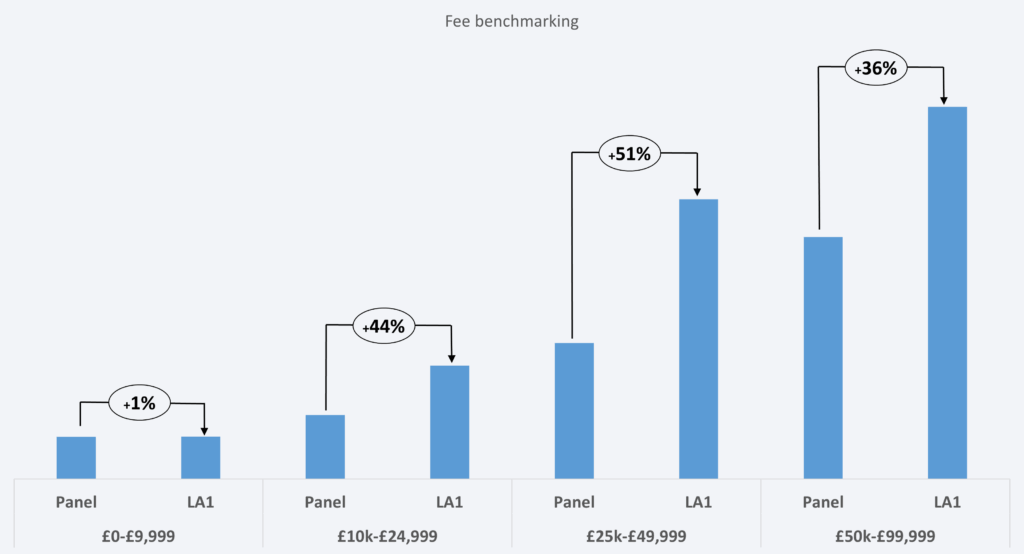
Having undertaken an in depth audit for a leading UK insurer, we found that there was a large difference in average fees. This was despite their being very similar commercial terms.
Firm LA1 was consistently billing more per settlement banding than the other panel firms. In the lower band (up to £10,000) there was no real disparity. In the two bands up to £50,000 however, there was a marked increase in fees.
Our findings showed that on lower value claims, most loss adjuster invoices were as per the fixed fees. At the next two bandings, LA1 was frequently requesting an hourly rate to be applied. This took the claim outside of the pre-agreed fixed fee. This made the average fee significantly higher than the panel average.
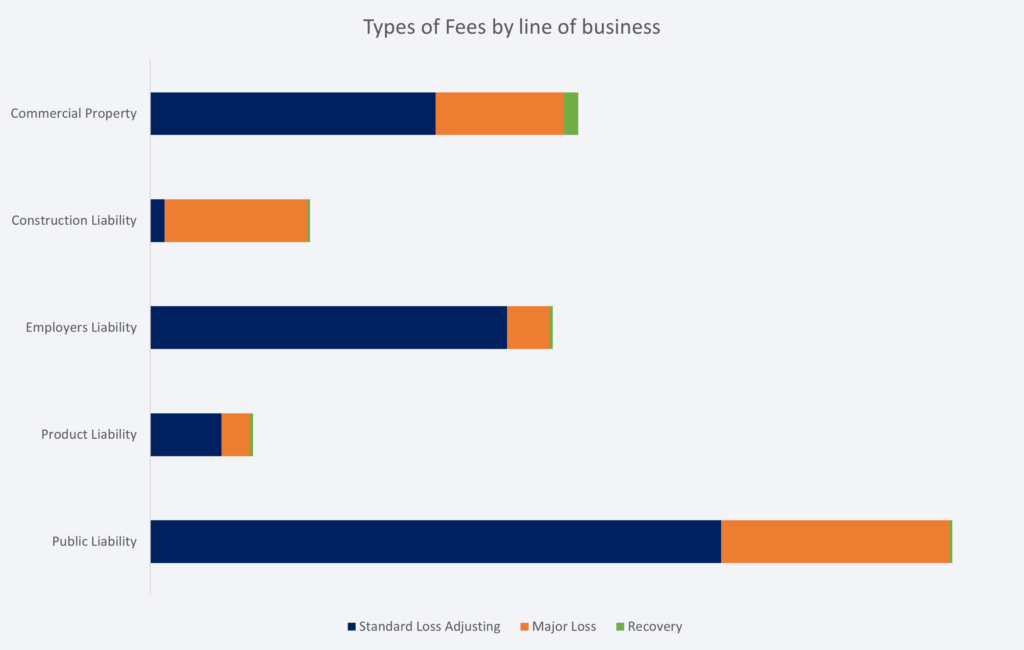
Service costs will naturally vary by line of business so it is vital when comparing average fees or total spend to do this by type.
For example, in a London market audit it was initially felt that the average fee claim settled was too high on Construction Liability claims. However, a data audit soon identified that the vast majority of claims required a major loss adjuster and therefore the application of hourly rates pushed up the average costs.
Conversely, commercial property average fees were the lowest as more claims were billed at the fixed fee bandings and at a recovery rate.
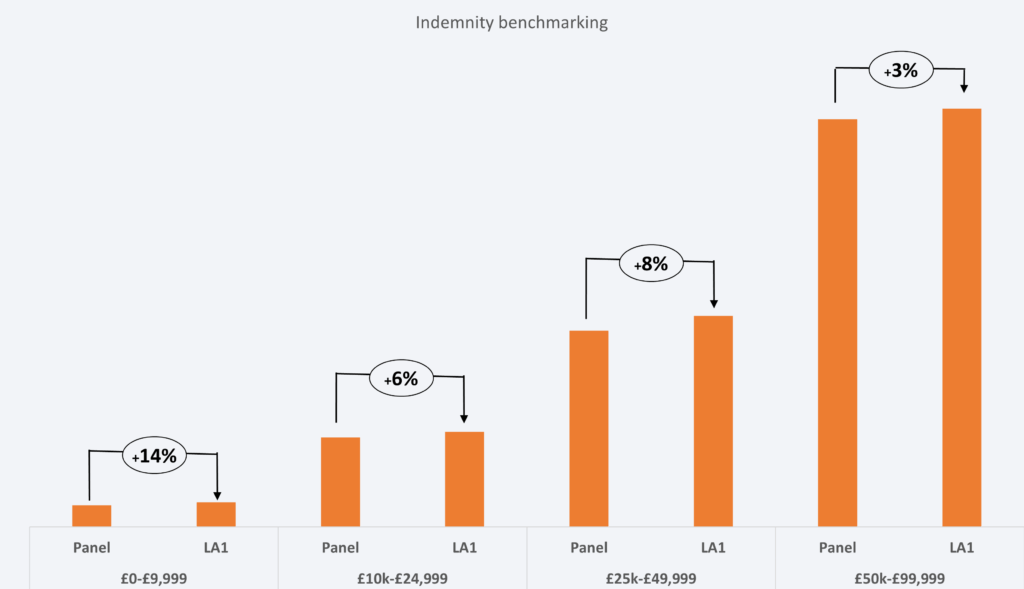
Fees are important but the biggest impact on the claims book is always going to be the indemnity spend. In the case of Loss Adjuster led claims it is ensuring that the panel firm is able to control costs in line with the policy terms and conditions.
In the case of firm LA1, when our audit showed their costs were higher than the panel average, they counter claimed that because of the quality of service, it still represented value for money.
Unfortunately when reviewing the claims outcomes, it became very clear that in fact the opposite was the case and the higher fee was matched by higher average settlement costs.
We generally find that TPA fees don’t self-fund; they won’t cover operational costs. As a consequence, the TPA function becomes a loss leader which can only operate at the fee levels they do if that function can feed another part of the business.
For example, we reviewed the TPA panel for a leading London syndicate’s US property book and found the following;
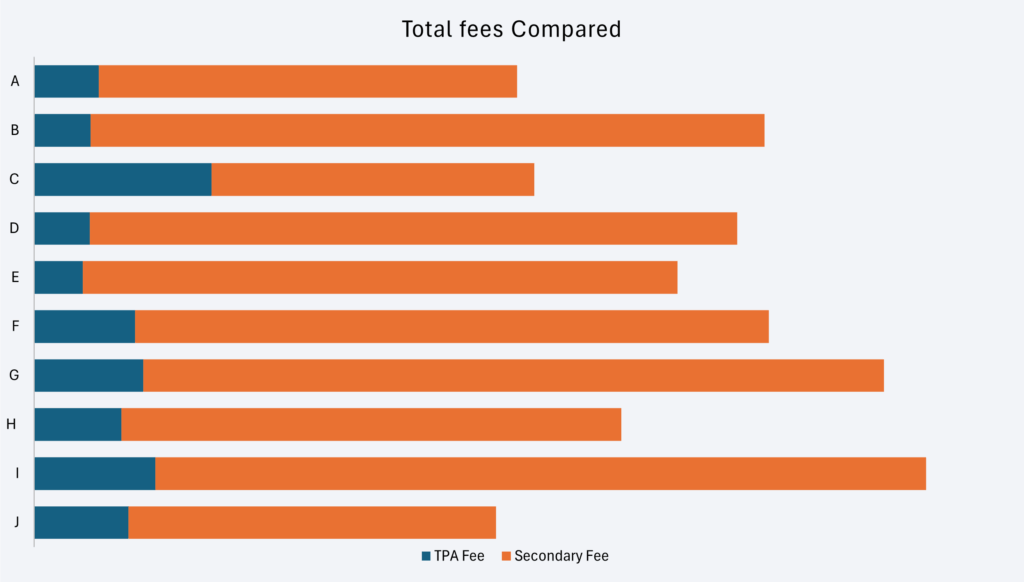
Taking 10 sets of TPA data which cover comparable lines of business, we can see that the secondary fee (loss adjuster or other owned service) is substantially more than the total TPA fee on its own.
Whilst a higher TPA fee can (Firm C) offset the need for higher secondary fees, that is not always the case (Firm I).
The key, as ever, is to be able to compare all aspects of associated fees to be able to provide accurate benchmark comparisons of costs.
Undertaking a full audit of a UK based TPA for a major insurance client, we soon discovered that their primary focus was revenue generation into the wider group.
On average, they were instructing their own companies 2.3 times for each TPA instruction they received. On a large number of instructions, up to 5 group companies were instructed.
The number of low value claims settled at desktop was minimal and secondary fees were spiralling out of control. As can be seen, the TPA fee element of total costs looked quite insignificant.


Fees are obviously only a small part of the overall claims spend. Indemnity, at least on most claims, will always be the higher proportion of total claims costs.
What we look for here is value for money. Larger claims incur larger fees, as do more complex claims even at a lower claims amount threshold.
So when we compare the total fees as a percentage of total claims costs (all fees + indemnity) we can start to draw comparisons between different TPA performances.
On the face of it, Firm E is providing good value for money, whereas Firm G really is not. There is of course a very important caveat to this assumption. If leakage is rampant then value for money will significantly drop. Equally, Firm J looks to be adding less value, but was achieving very strong indemnity controls and fraud detection rates.
It is not just about costs, but service too. When TPA’s instruct themselves it adds complexity and time delays to the claims duration.
Looking at a simplistic measure of indemnity spend vs elapsed days, it is evident that Firm H is taking too long to settle low value claims. In contrast Firms A and G are concluding claims in half that time.
Elapsed days are only one customer measure, but it is an important one.


