We have undertaken extensive reviews and rate negotiations for legal services across all lines of

We have undertaken extensive reviews and rate negotiations for legal services across all lines of

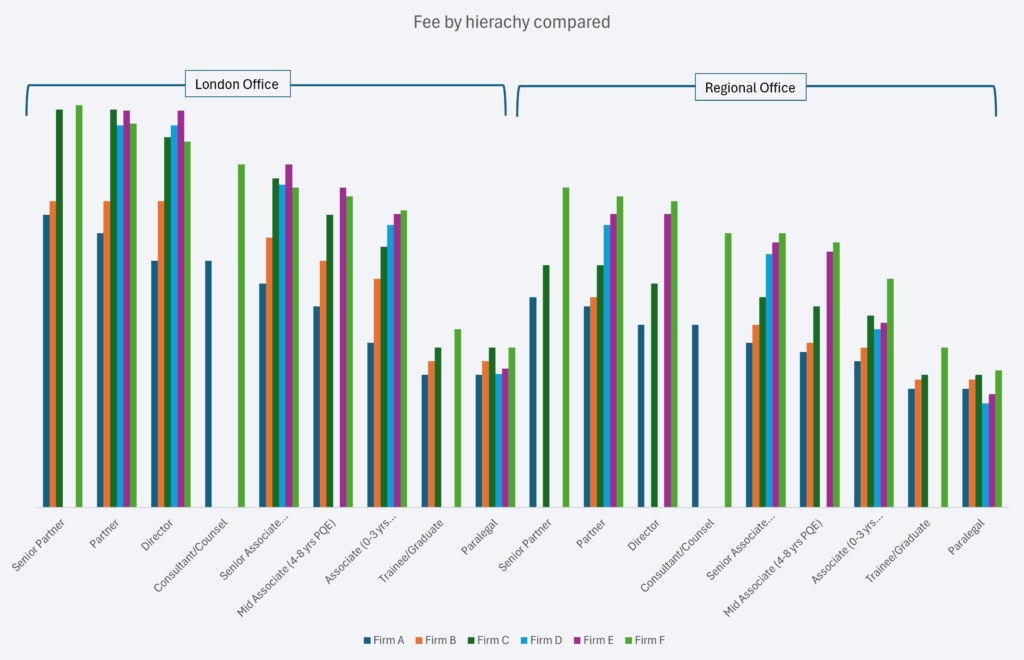
Starting with the basics – comparing different firms rates by fee hierarchy. This is done by lines of business and then separated out into different offices, namely London and then regional.
As can be seen there is a wide difference in rates by firms. And all firms offer markedly cheaper rates in regional hubs compared to London offices.
We have extensive rates for comparison, although at this stage it is not possible to provide meaningful insights without further data analysis.
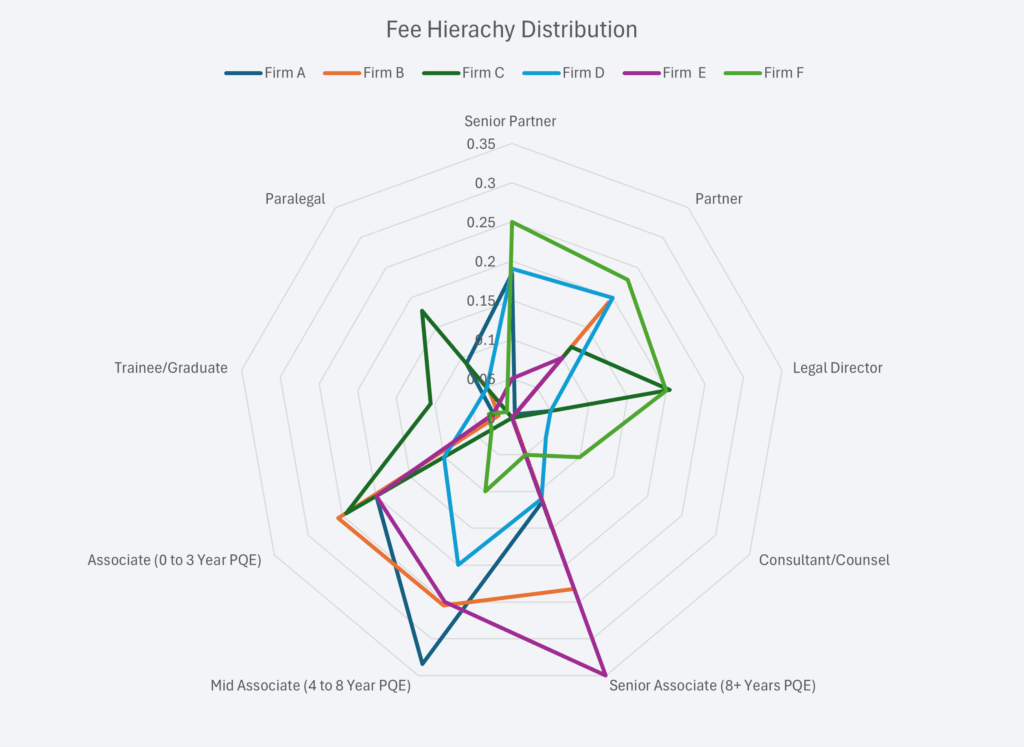
To get towards having a meaningful data set for comparison purposes, we first need to see where each firms fee distribution is.
As is evident in the data set, there is a marked difference between firms of which fee hierarchy is the most prevalent. Firm F is very heavily weighed towards the top 3 earners (Senior Partner, Partner and Director). Firms B and E are more weighted to the associate bandings.
This makes a big difference to the overall weighted fee per hour when comparing firms.
To obtain a true picture of the average fee per hour by firm, we undertake this process for both the London and Regional offices. We then apply a weighting to the usage of these offices, and arrive at a final blended rate per hour.
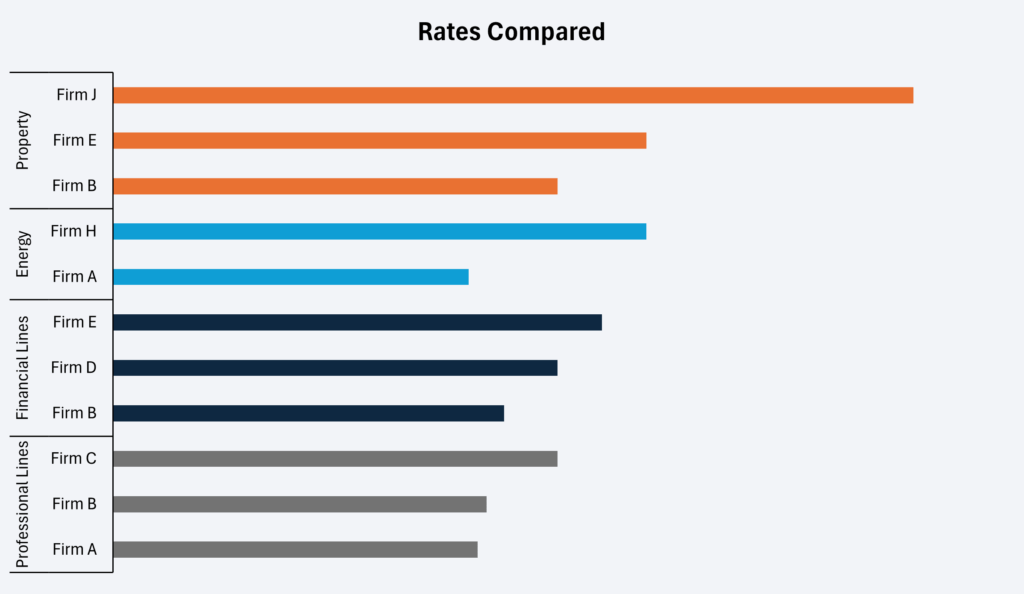
Hourly rates will vary by the Line of Business the matter will relate to. We compare all rates from an insurers panel, applying the blended average. By doing this we are able to compare true costs per hour across any panel firm.
Once we have collated the cost data we are able to immediately see the disparity in costs by firms. For example, on Property matters, is Firm J really worth the extra uplift on costs compared to Firms E and B? Often the answer is yes so the next stage is to quantify why that is.
In most cases though, the general feedback is that the panel firms are, to a lesser or greater degree, equal. In which case we adopt a two tier approach:
Comparing existing legal providers is a highly effective way to reduce costs within the panel. However, you don’t know how cost effective the panel is compared to the wider market.
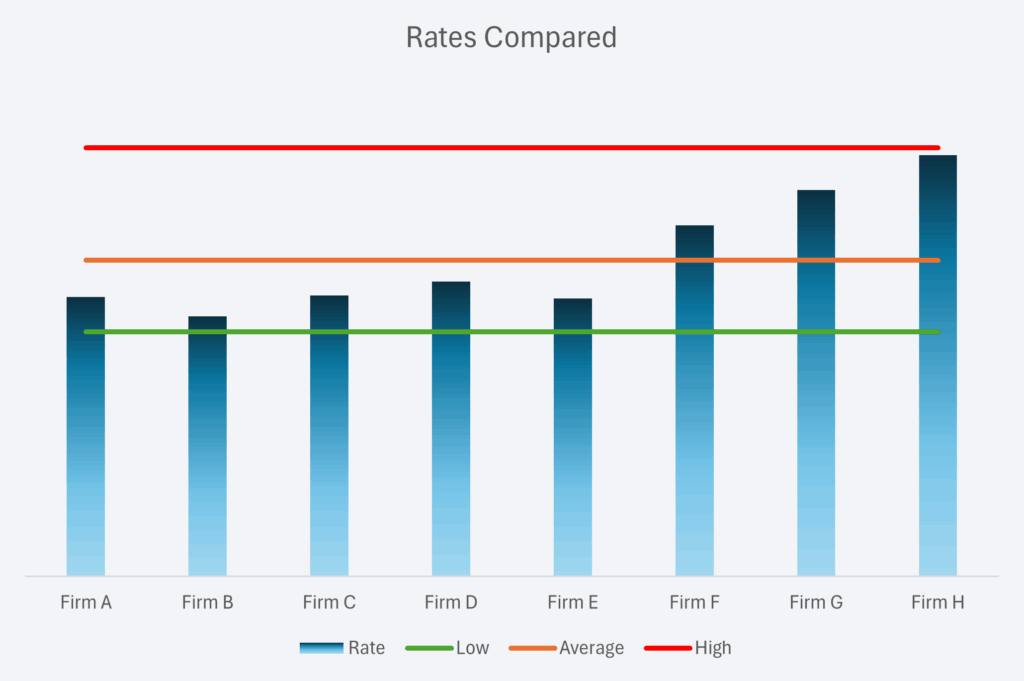
We have thousands of data points collected as a wider industry benchmarking. As such we are able to provide an insight into how your cost base compares to the wider market.
Whilst Firms A through E are all billing an average hourly fee below the market average, Firms F through H are comparatively high. Firm H is approaching the top rate found in the market.


Follow the money.
Starting with your own financial records and known payees, we start to build up a picture of the likely spend.
We then cross referenced this against the suppliers own financial records. In this way, a true picture of the claims supplier spend is built up.
Working with your teams, we issue Raw data requests covering not just financials but key performance data and sub-spend detail. By way of an example, this might include the office location where the work was undertaken and the partner who actually did the work.
We then are able to build up a profile of what you are spending with what firms.
A lot of time and effort can be spent here trying to get the numbers to match 100%. Our best advice is to get to a matching rate of above 80% and stop.
Build a picture of your spend.
Once we have received the financial data covering spend we are able to build a picture of what you are spending and where.
We then discuss rates and negotiate client-specific rates rather than using the “walk-in” rates that suppliers typically apply without a formal agreement.
Other activity covered;
Our aim is to get you on the correct rates with management controls in place to ensure that the suppliers are adhering to best practice.


Managing claims supply spend effectively is crucial. But before you can optimize, you need to


