We have undertaken extensive reviews, audits and tenders for personal lines building repairs. Once you understand the key levers of control, managing your spend becomes an easier task.
The key drivers to your spend control will be the model you use and the controls inherent in the building process. Cash is increasingly king. Consumer duty means that any supply chain activity, like building repairs, that has a liklihood of a complaint is not ideal. Cash is quiet in this respect. Cash is also cheaper. The VAT and HSE element can be avoided using local trades chosen by the consumer. However, the lowest DIY rate is no generally no longer applied (Consumer Duty).
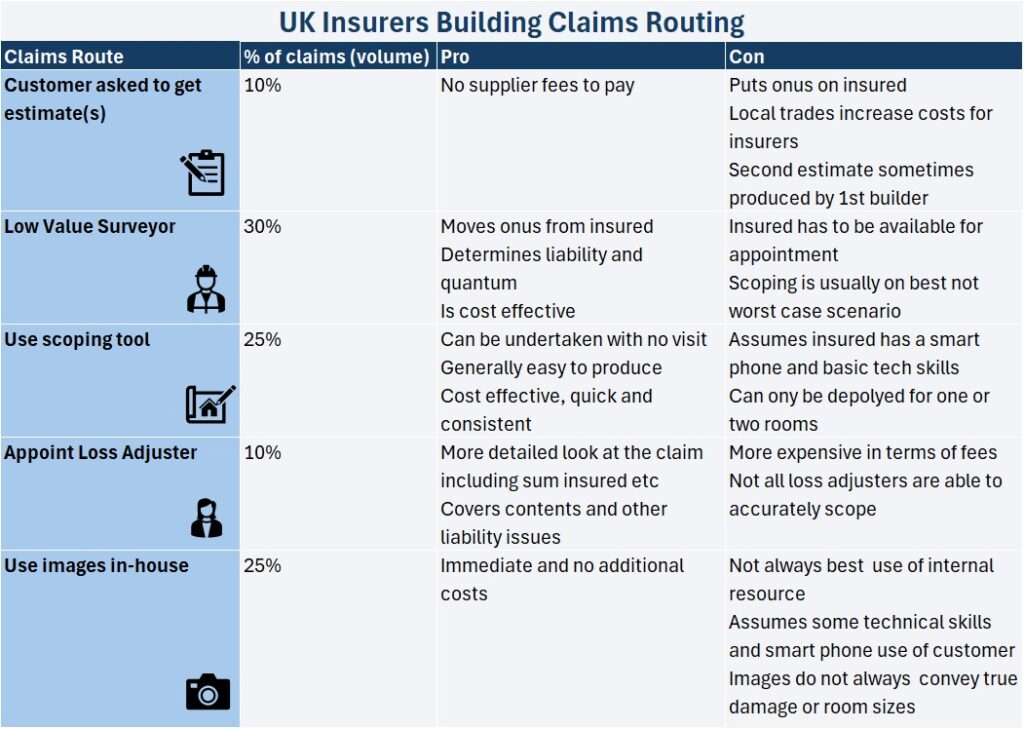
The key is the claims routing before you can start the benchmarking.
Not all claims are equal. Certain perils have very different liability considerations and outcomes than others.
Based on 2024 settlements, claims for storms are frequently declined with only 32% of all claims made leading to a claims settlement. For that reason, establishing if a claim is valid is the primary concern. This is why more experts (surveyors/loss adjusters) are appointed on this peril.
Conversely, Excape of Water (EOW) claims result in a claims settlement in 82% of all claims made. The focus is therefore more on the claims amount to be agreed than coverage itself.
In addition to the peril type, the claims distribution by route depends on how each insurer’s claims department is set up. Some are pushing more through automated routes (up to 70%), whereas others will outsource more.
We have comparable data in the industry for outcome type. The focus of the property spend comparions is on the settlement amount.
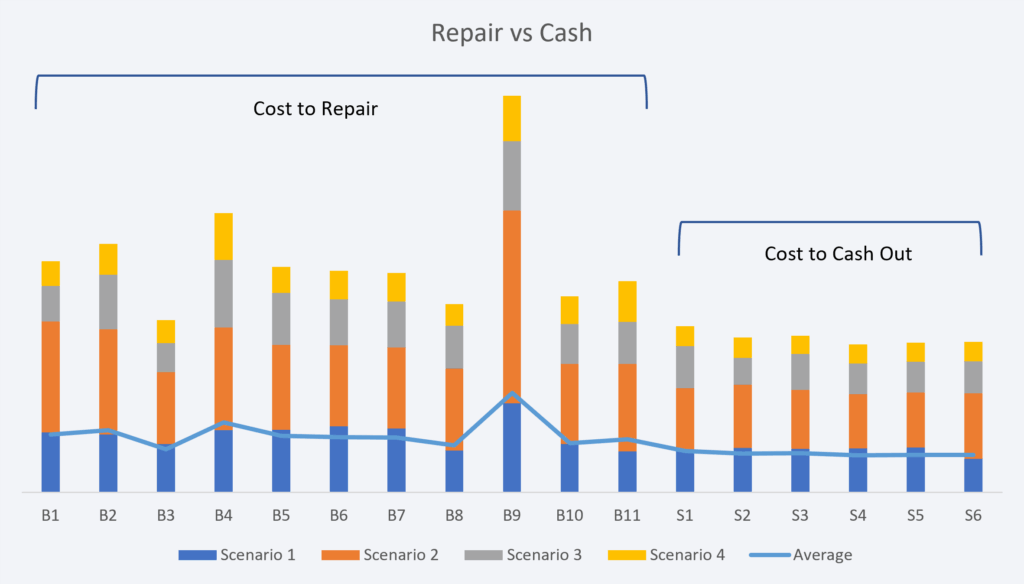
Repair vs cash.
Cashing out a building repair is cheaper than repairing it via an approved builder. Looking at our data set covering the same repairs, using a network builder always costs more.
The main reason is larger builders carry a heavier administration cost base. Support staff process and report on the claims element as well as liasing with insurers and other parties. Additionally, most insurers use buildings claims software which cost the builder on a per click basis.
Finally, most have to charge VAT on labour and materials unlike some smaller local trades who charge VAT on materials only.
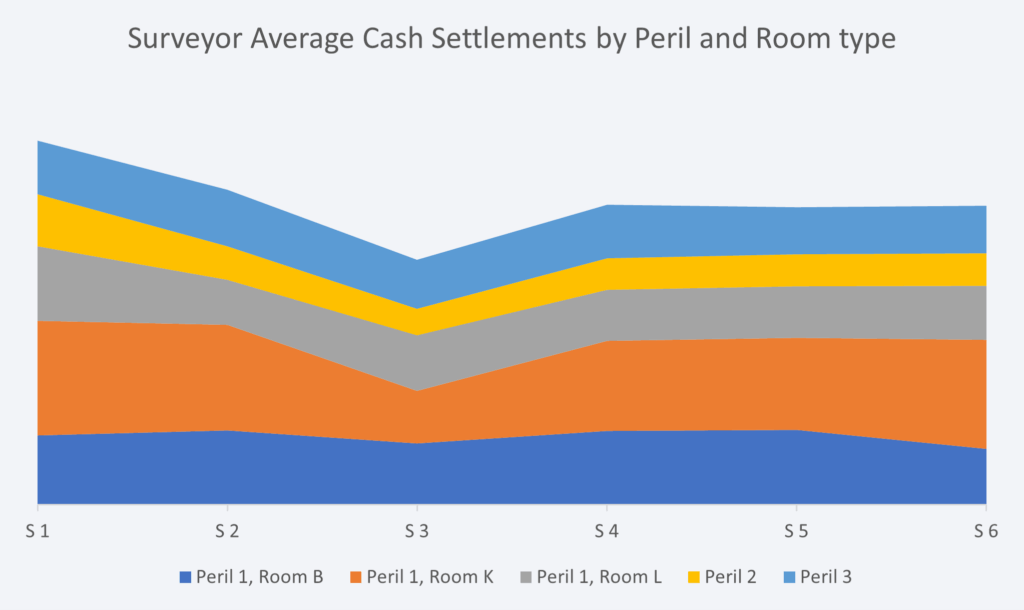
Focussing on the cashing out amount.
Using multiple data points across room type and peril, we can compare cashing out amounts across a typical selection of claims.
When it comes to scoping a repair, it is normal to get different estimated repair costs. In fact using the same methodology and systems, no two estimates are the same. No matter how skilled the estimator is. So to get variations accross different firms is to be expected.
What we are looking for is consistancy over a “basket of goods”.
What can be seen in this analysis is the grouping of cash settlements. Suppliers S2, S4, S5 and S6 are returning consistant (albeit sightly different) cost estimates. S1 is overscoping on each scenario. Conversely S3 is under valuing the claim amount.
Lower costs are good though right? Not when they are clearly below the market rate. Consumer Duty must be considered. In the event that the customer takes the cash and tries to engage a local trade, they will find out that they have been under paid. This has two implications:
- A complaint will be made.
- The claim will need to be reopened and re-visited.
Both of these cost money. So any savings made by undervaluing the claim are lost.
Builder repair rates.
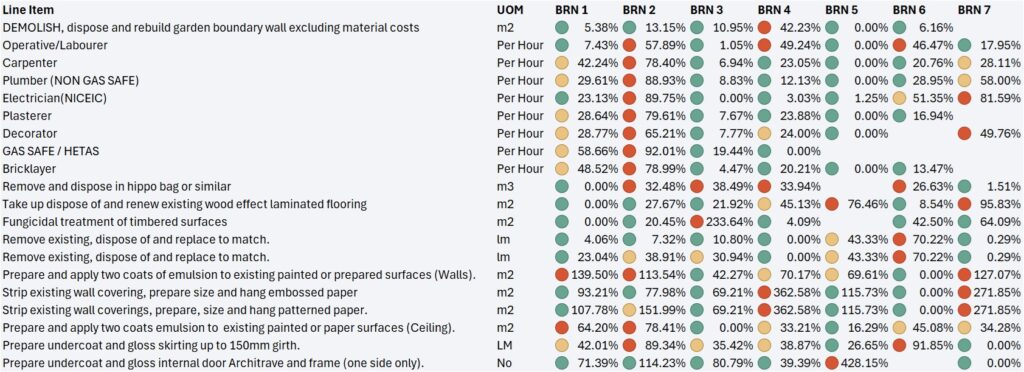
To start to understand how to compare builders and network costs, we first need to look at the rates used.
Even if you are able to agree a consistant rate card for each repair element, there will be always be regional differences on labour costs. (Materials tend to be uniform).
As can be seen, there is a vast difference between these seven national builders when it comes to individual line items.
Builder claims costs compared
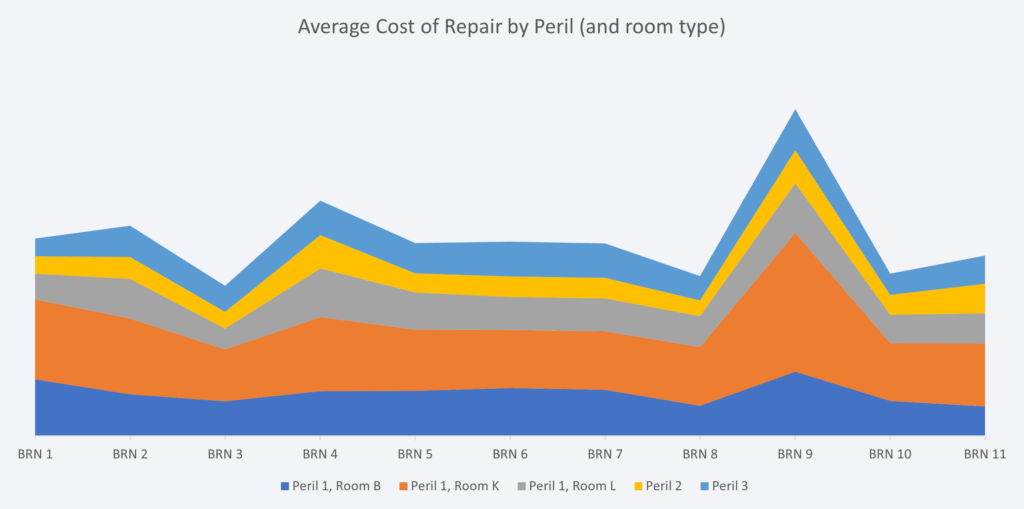
Although individual rate comparisons are useful, it is the application of these rates that will drive the largest difference in repair costs.
Using the same methodology as for cashing out, we have multiple data points on a typical claims portfolio. As can be seen, there is an averaging out accross suppliers BRN1, BRN2, and BRN’s 5 to 7. BRN’s 3, 8 and 10 are significantly lower, with BRN 9 an expensive outlier.
Again, this is fairly typical from the audits we have undertaken. High cost overheads and over scoping can be common. Conversely, low costs and tight scoping can lead to very affordble, yet quality repairs.
When it comes to engaging with a builder network rather than individual firms, the key is the assessment of how tightly that network manages the individual builders.
Builder network fees
When you engage with a network instead of individual builder firms, the final aspect to consider is the fee structure. Whilst a builder earns profits from the rate card, the network needs a fee income to cover their management costs.
Our best advice is to avoid a percentage applied to the repair cost. It is expensive and it rewards higher repair costs.
Instead look to have a fixed fee banding applied to the claim.
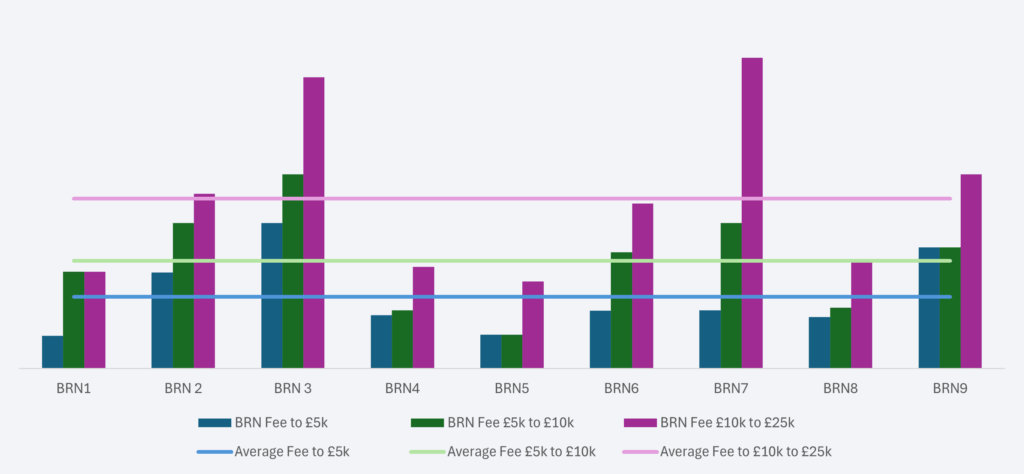
As can be seen, fees vary considerably. Too low and there will inevitably be fewer controls on the repair costs. Too high, and you are not getting value for money.
Lookng at the data, at first glance it appears that BRN 3 and 7 and simply too expensive. However, if you look at the bandings, BRN 7 is more proportionate to the increased repair costs. If the indemnity controls (repair costs) show that they are controlling that spend, it may well be worth the increase. BRN 3 is simply too expensive, especially at lower value repairs where controls will not deliver reduced costs.