Not all TPA’s are equal. Not even close in some cases. We have undertaken extensive reviews, tenders and audits to know what to look for with a view to helping clients understand the impact of different models on claims indemnity costs and time to serve.
We generally find that TPA fees don’t self-fund; they won’t cover operational costs. As a consequence, the TPA function becomes a loss leader which can only operate at the fee levels they do if that function can feed another part of the business.
For example, we reviewed the TPA panel for a leading London syndicate’s US property book and found the following;
- Of the 7 panel firms used, 2 had higher fees agreed (per claim) than the other 5.
- However, the instruction rate to a Loss Adjuster averaged circa 22% of all claims processed for those 2.
- Whereas the other firms, who owned their own loss adjuster companies, were averaging over 50% instruction rates.
- And the worst “offender” was instructing themselves on 70% of all claims received.
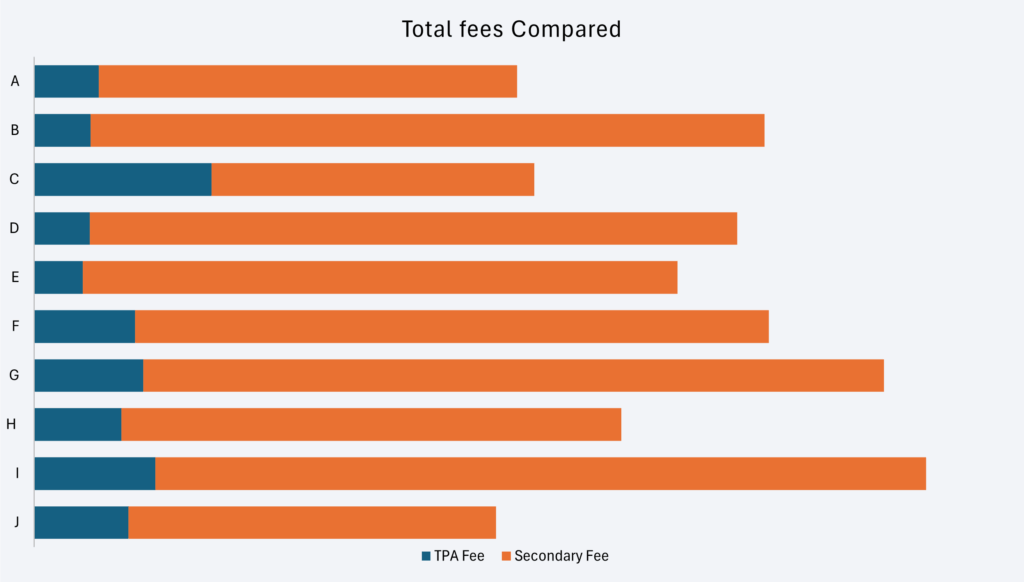
TPA fees compared
Taking 10 sets of TPA data which cover comparable lines of business, we can see that the secondary fee (loss adjuster or other owned service) is substantially more than the total TPA fee on its own.
Whilst a higher TPA fee can (Firm C) offset the need for higher secondary fees, that is not always the case (Firm I).
The key, as ever, is to be able to compare all aspects of associated fees to be able to provide accurate benchmark comparisons of costs.
Secondary Fees in more detail
Undertaking a full audit of a UK based TPA for a major insurance client, we soon discovered that their primary focus was revenue generation into the wider group.
On average, they were instructing their own companies 2.3 times for each TPA instruction they received. On a large number of instructions, up to 5 group companies were instructed.
The number of low value claims settled at desktop was minimal and secondary fees were spiralling out of control. As can be seen, the TPA fee element of total costs looked quite insignificant.


Fee Costs vs Indemnity Spend
Fees are obviously only a small part of the overall claims spend. Indemnity, at least on most claims, will always be the higher proportion of total claims costs.
What we look for here is value for money. Larger claims incur larger fees, as do more complex claims even at a lower claims amount threshold.
So when we compare the total fees as a percentage of total claims costs (all fees + indemnity) we can start to draw comparisons between different TPA performances.
On the face of it, Firm E is providing good value for money, whereas Firm G really is not. There is of course a very important caveat to this assumption. If leakage is rampant then value for money will significantly drop. Equally, Firm J looks to be adding less value, but was achieving very strong indemnity controls and fraud detection rates.
Customer Service
It is not just about costs, but service too. When TPA’s instruct themselves it adds complexity and time delays to the claims duration.
Looking at a simplistic measure of indemnity spend vs elapsed days, it is evident that Firm H is taking too long to settle low value claims. In contrast Firms A and G are concluding claims in half that time.
Elapsed days are only one customer measure, but it is an important one.